Oracle Monitoring SQL Selection (1)
Oracle database monitoring usually involves multiple levels such as performance, space, session, object, backup, and security.
Effective monitoring can help DBAs discover and solve problems in a timely manner, improve the stability and performance of the database, and ensure the company’s data security and business continuity.
Commonly used monitoring indicators include:
- Performance Index:
- Query response time: measures how quickly a query is executed.
- CPU Utilization: Monitor CPU usage to ensure there is no overload.
- Memory Utilization: Tracks memory usage, including PGA and SGA usage.
- Disk I/O activity: Monitor the frequency and data volume of disk read and write operations.
- Network throughput: A measure of the rate at which network data is transferred, typically monitored on network devices.
- Space Management:
- Table space usage: Monitor the usage and growth trend of each table space.
- Data file growth: Track the size changes of data files.
- Sessions and connections:
- Number of active sessions: counts the number of currently active sessions.
- Waiting event monitoring: Analyze the resources that the session is waiting for.
- Logs and Alarms:
- Database error log: Monitor error logs to respond to issues quickly.
etc.
Next, three practical SQL statements are introduced, covering basic scenarios of Oracle monitoring.
- Statement to query PGA memory usage
The first SQL statement is used to query the usage of PGA (Program Global Area) memory in the Oracle database.
The PGA is a non-shared memory area allocated by Oracle for each session to store session-level data and control information.
1 | SELECT PID, PROGRAM, PGA_USED_MEM, PGA_ALLOC_MEM, PGA_FREEABLE_MEM, PGA_MAX_MEM |
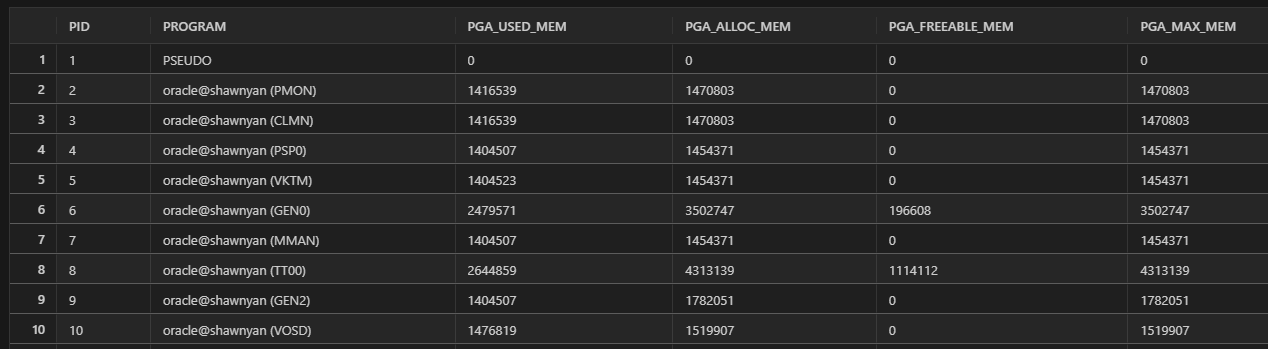
- PID: Process ID, a unique number that identifies the Oracle server process.
- PROGRAM: The name of the running program, typically used to identify what the session is doing.
- PGA_USED_MEM: The amount of PGA memory used by the current process.
- PGA_ALLOC_MEM: The total amount of PGA memory allocated for the current process.
- PGA_FREEABLE_MEM: The amount of PGA memory that the current process can release back to SGA (System Global Area).
- PGA_MAX_MEM: The maximum value of PGA memory allocated for the current process.
This statement selects relevant information from the dynamic performance view GV$PROCESS, which provides detailed information about the Oracle process, including PGA memory usage.
- Query statements for system metrics
The second SQL statement is used to query the system metrics of the Oracle database, including various performance indicators.
1 | SELECT METRIC_NAME, VALUE |
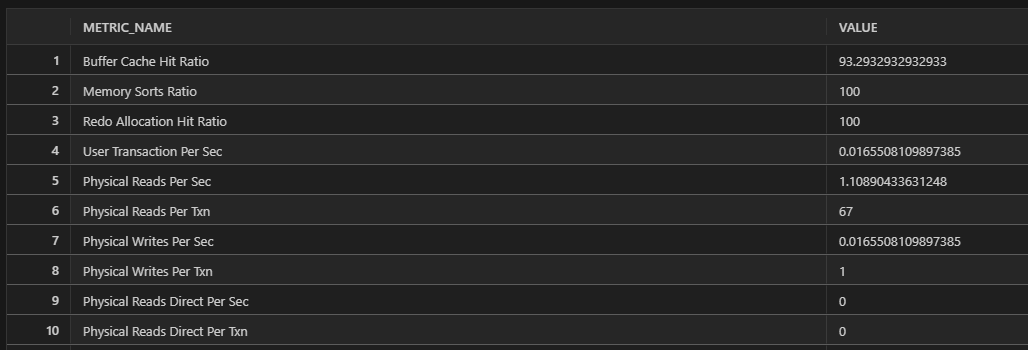
- METRIC_NAME: The name of the system metric, such as CPU usage, physical memory usage, etc.
- VALUE: The value of the corresponding metric.
- BEGIN_TIME: The time when the measurement started.
This statement selects the names and values of all system metrics from the dynamic performance view GV$SYSMETRIC, sorted by BEGIN_TIME.
The GV$SYSMETRIC view contains real-time performance measurements of the Oracle database. For database administrators, this information is critical for monitoring and optimizing database performance.
- Statement to query table space usage
The third SQL statement is used to query the usage of each table space in the Oracle database, including used space, total space, usage percentage, etc.
1 | SELECT |
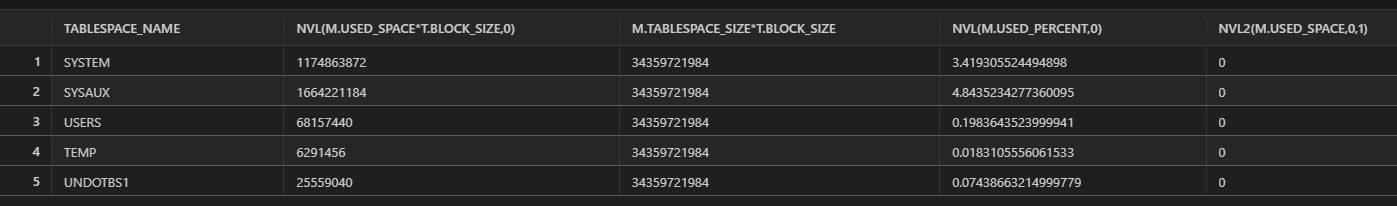
- tablespace_name: The name of the tablespace.
- used_space: The number of used blocks in the table space.
- block_size: The size of each block in the table space, usually in bytes.
- tablespace_size: The total number of blocks in the table space.
- used_percent: The usage percentage of the table space.
This statement obtains table space usage information by connecting the two data dictionary views dba_tablespace_usage_metrics and dba_tablespaces.
dba_tablespace_usage_metrics provides tablespace usage metrics, and dba_tablespaces provides tablespace details.
Through this information, DBA can understand the current usage of each table space, so as to carry out reasonable space management and planning.
These three SQL statements are commonly used query statements by Oracle DBA when performing database performance monitoring and space management.
Hope this helps you.
– END. –

如果这篇文章为你带来了灵感或启发,就请帮忙点『赞』or『在看』or『转发』吧,感谢!(๑˃̵ᴗ˂̵)
Author: Shawn Yan
Link: https://shawnyan.cn/2024/oracle/oracle-monitor-sql-1-en/index.html
License: All articles on this site are original unless otherwise stated. Please indicate the source when reprinting!